Table of contents
- 1. Publication bias & Small-study effects
- 2. Examining PB visually: Funnel plots & P-curve
- 3. Examining PB statistically: Statistics & Tests
- 4. References
1. Publication bias & Small-study effects
Generally speaking, it means that the studies selected for your meta-analysis are systematically different from all available relevant studies; Specifically, there is an association between the likelihood of a publication and the statistical significance of a study result.
If the missing studies are just a random sample of all the studies relevant to your topic, there will be no bias, and your analysis will remain valid, although less precise. However, if there is a systematic difference between the missing studies and the included studies, such as smaller studies with non-significant results not being published, then the results of your meta-analysis will be biased towards a significant result.
Small-study effects vs. Publication bias
- Small-study effects refer to the phenomenon where smaller studies tend to report larger effect-size estimates compared to larger studies.
- Small studies have small sample sizes, and thus their SE are generally larger. Therefore, we expect their estimated effect sizes to vary more widely (compared to big studies). However, if studies with estimated effect sizes tending towards zero are not published, then the small studies we see in the literature are often those with large effect sizes on the other side.
- Hence, publication bias is one of the most well-known reasons for small study effects.
2. Examining PB visually: Funnel plots & P-curve
Funnel plots

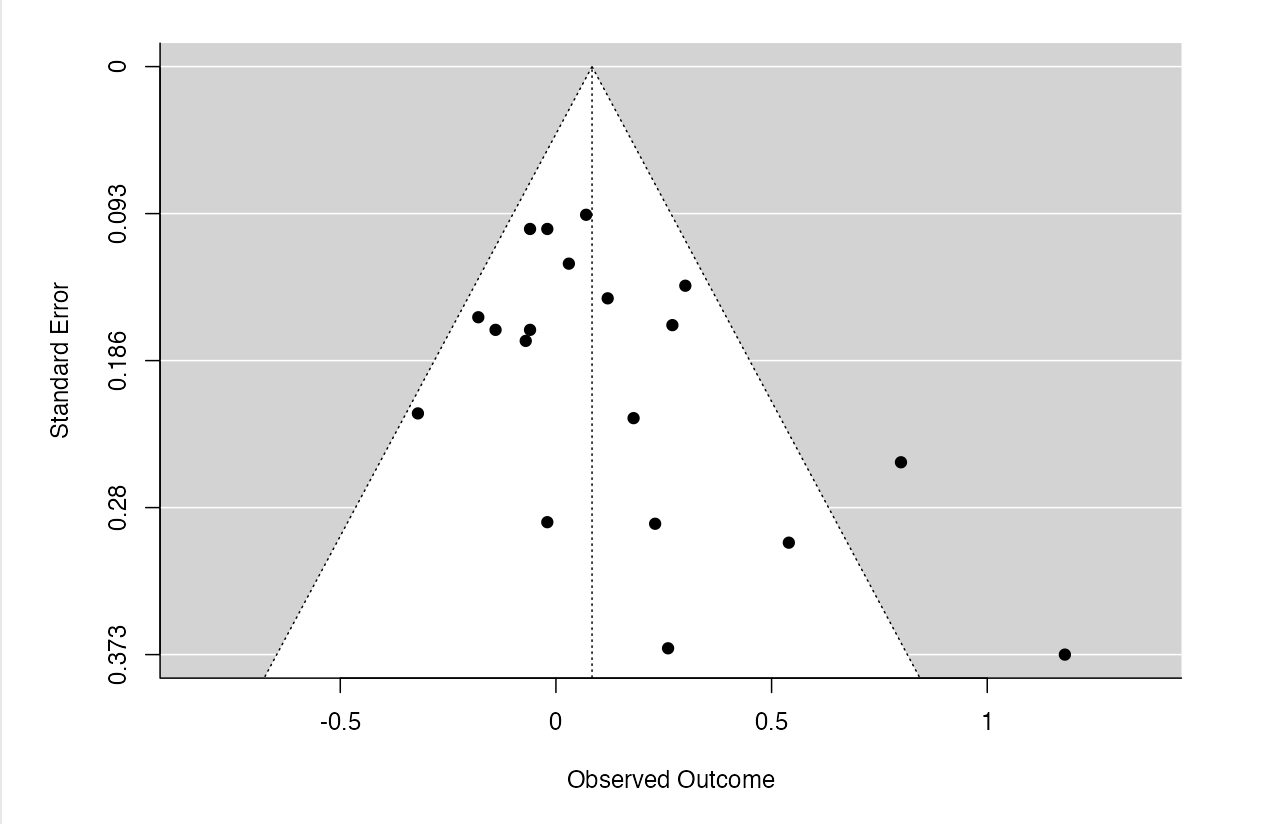
- X: effect size; Y: standard error (sample sizes sometimes)
- The central dashed line: estimated overall effect size
- The scatter will be a symmetrical funnel shape in the absence of PB:
- The studies should be distributed symmetrically around the overall effect size because the sampling error is random, in the absence of PB.
- Studies with a large standard error, which are often smaller studies, will have a more variable estimated effect size.
- Hence, if the scatterplot reveals an asymmetrical funnel, there might be PB.
P-curve: “P-Curve” by Simonsohn, Nelson, and Simmons - YouTube

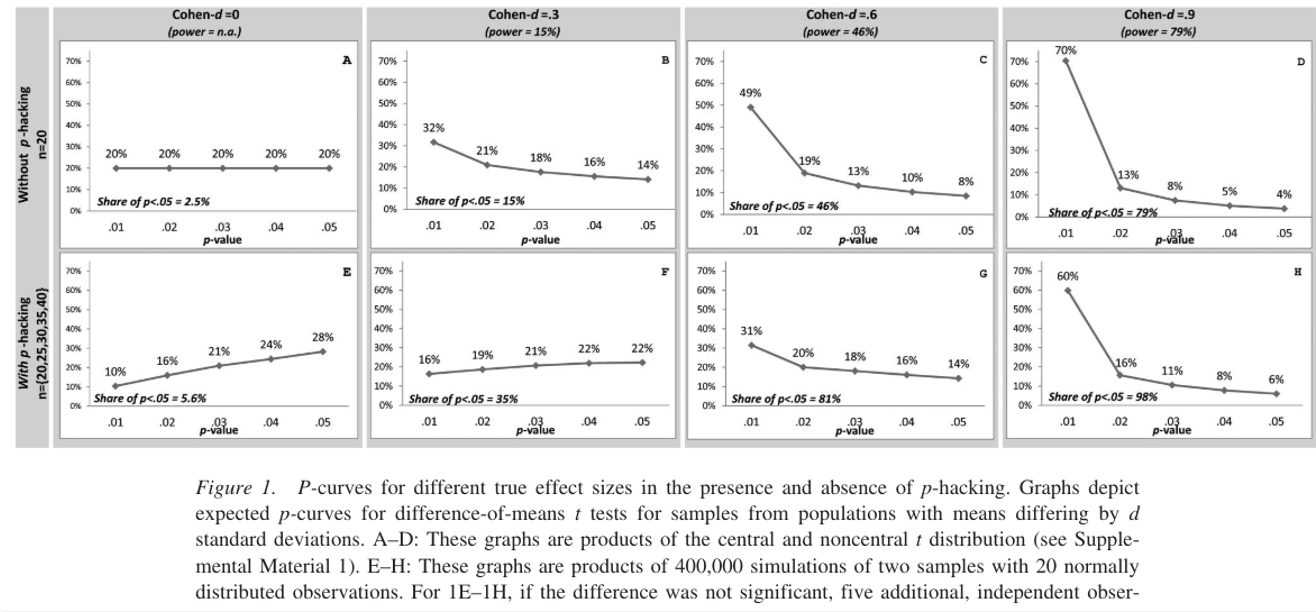
- It plots the distribution of p-values for collected studies.
- If there is no “p-hacking”:
- No effect: uniform distribution
- Has an effect: right-skewed distribution (steeper with more power)
- 但如果发现left-skewed distribution(0.05附近的频率很高),就要怀疑p-hacking了。
3. Examining PB statistically: Statistics & Tests
1) Fail safe number (Rosenthal’s version)
- It calculates how many studies would need to be added to the meta-analysis in order to render the population effect size non-significant → If only a few studies were needed, you should be worried about your estimated population effect size.
- However, due to some technical concerns, Rosenthal’s fail-safe N isn’t considered acceptable today.
- However, you can use Orwin’s fail-safe N, a modified version. This version allows you to set two things: 1) the minimal threshold for the population effect size that remains meaningful (as opposed to Rosenthal’s method, which sets it exactly at 0), and 2) the average effect size of the missing studies (in contrast to Rosenthal’s method, which also sets it exactly at 0).
2) Trim-and-fill method

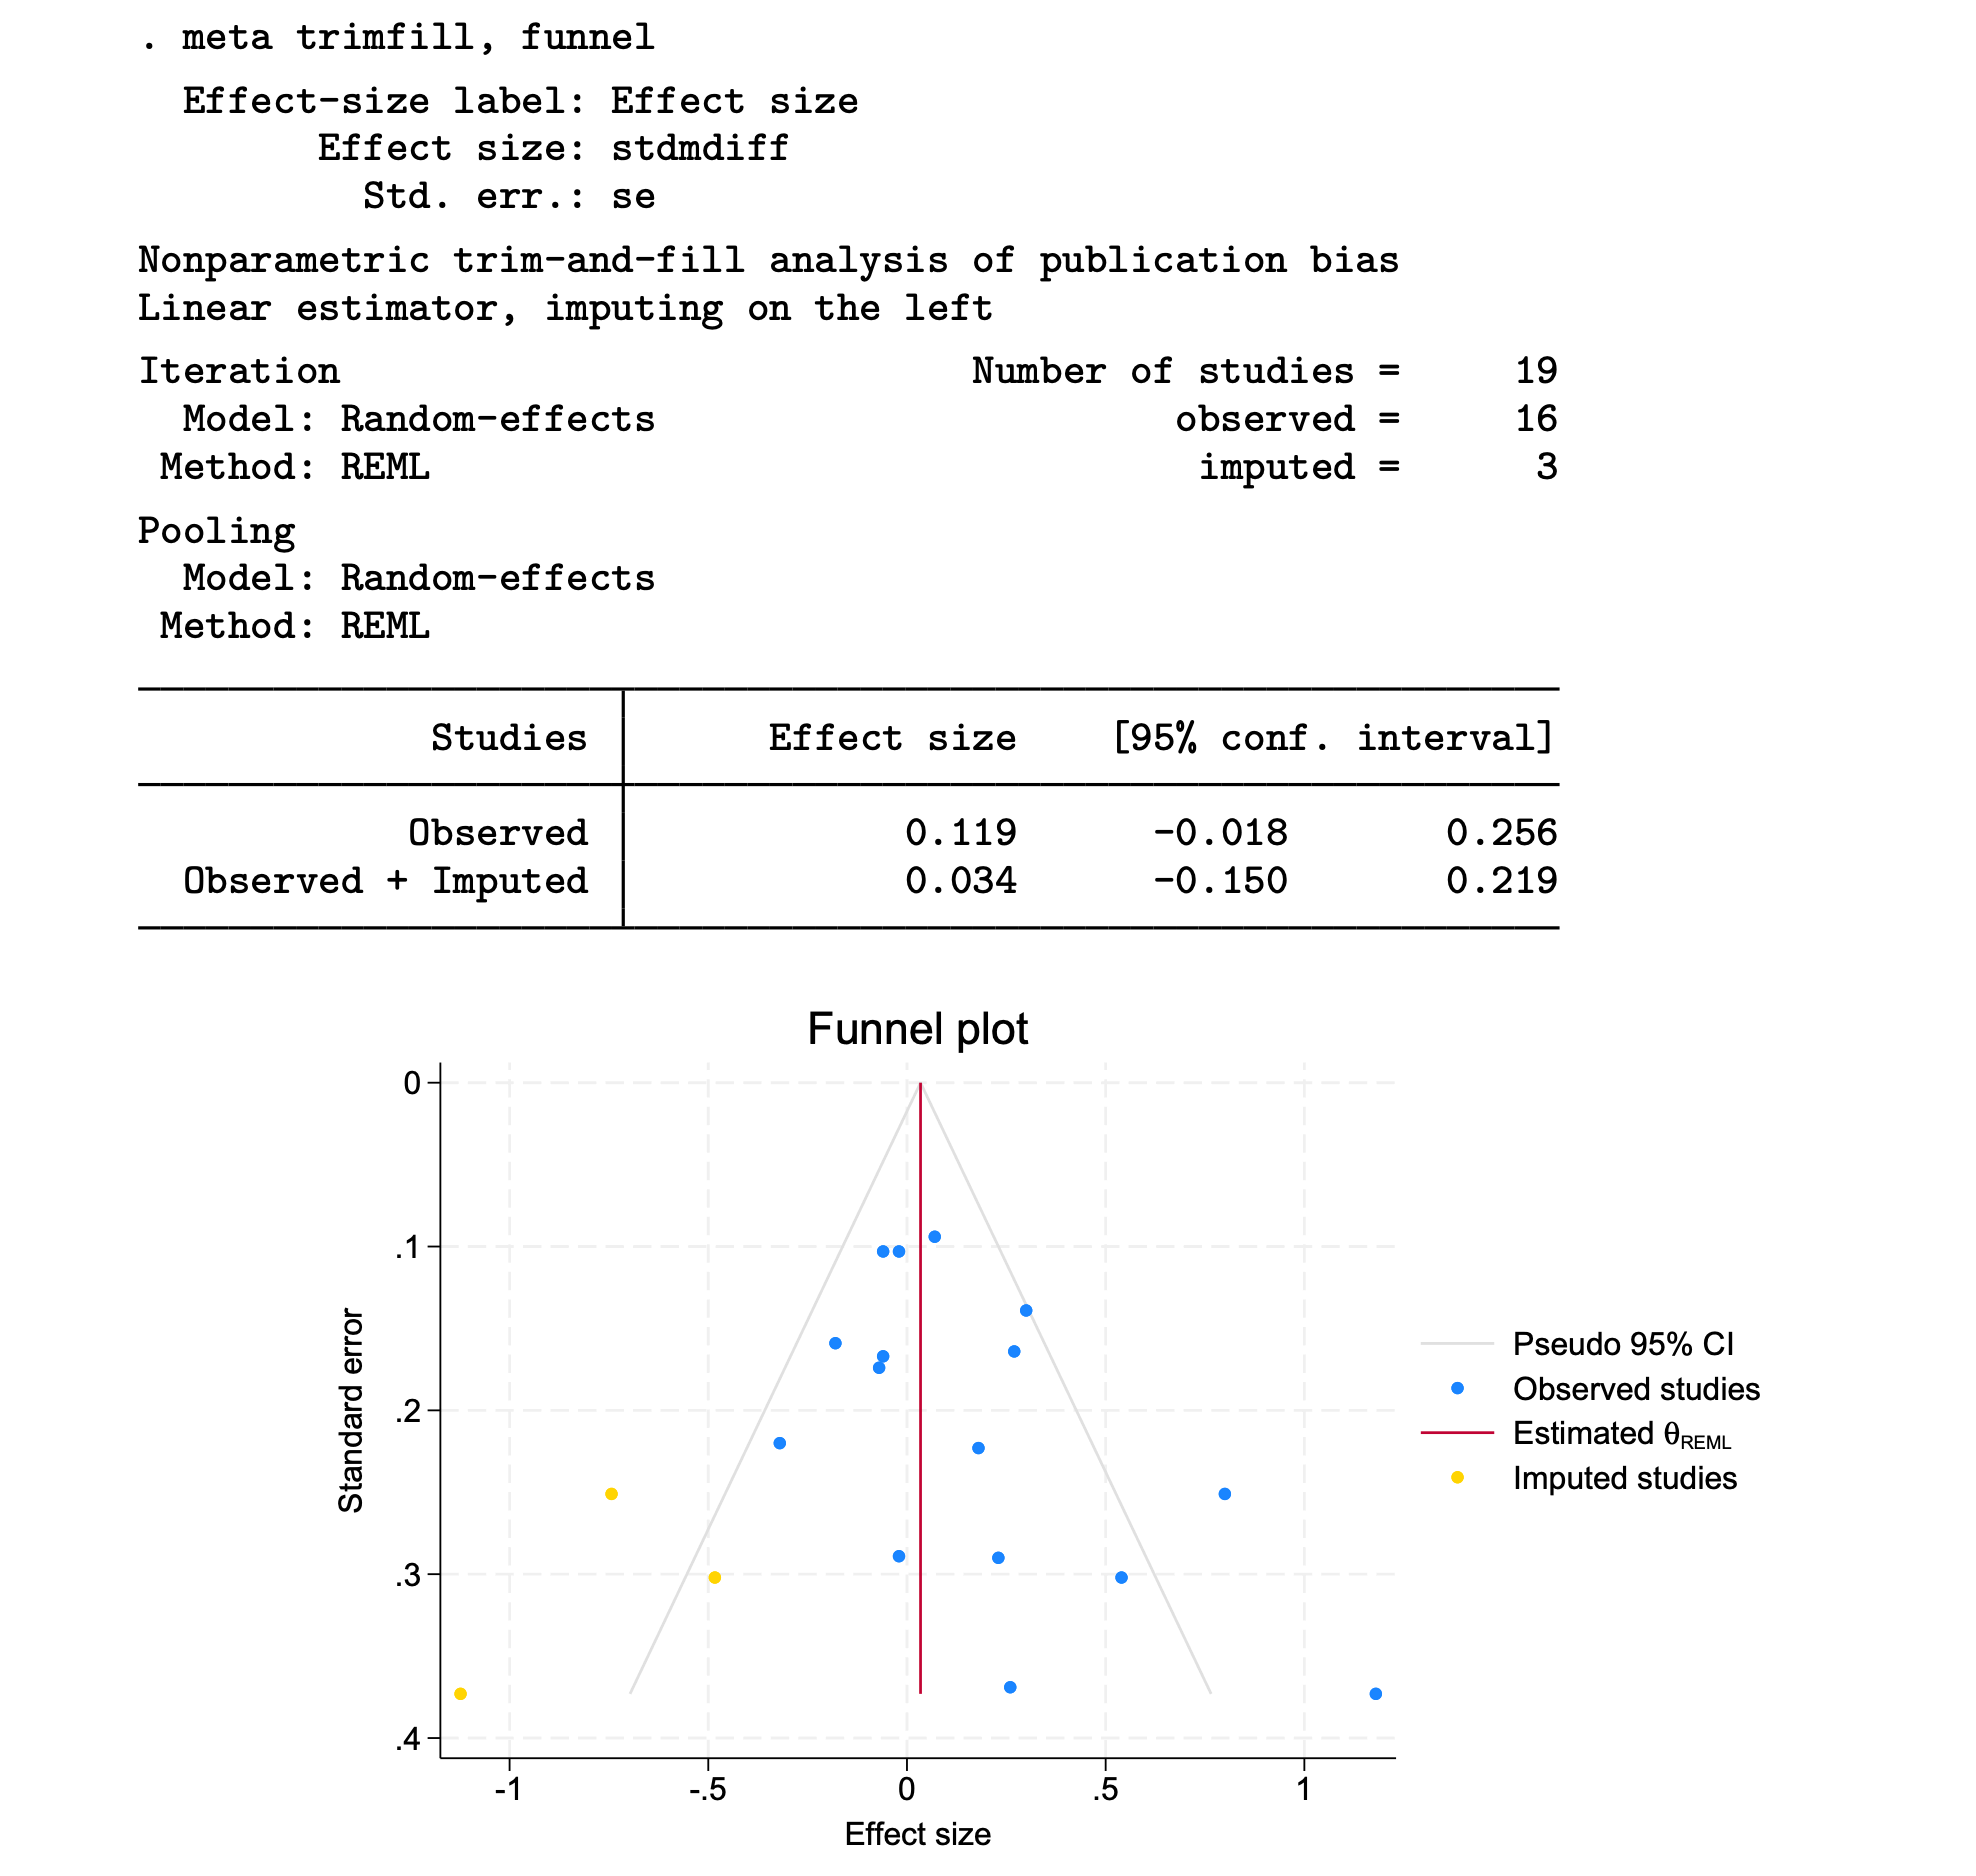
- It 1) estimates the number of studies potentially missing from a meta-analysis because of publication bias, 2) imputes these studies, and 3) computes the overall effect-size estimate using the observed and imputed studies.
- MAJOR貌似只报告了imputed studies的数量,没有报告corrected effect size。
3) Egger’s linear regression test
- A regression-based approach
- It tests whether there is a statistically significant association between the effect sizes and their measures of precision such as effect-size standard errors——想象一个无PB的funnel plot:将XY轴调换并调整异方差,此时拟合的直线应该是一条水平线,斜率为0。
- H0: there is no PB/SSE (i.e. no significant relationship between θ and se).
- There are some criticism about Egger’s method.
4) Begg’s rank correlation test
- A nonparametric approach
- The principle is identical to that of Egger’s method (same H0)
- Its power is low because it is a nonparametric test, especially if there are small numbers of studies: “fairly powerful with 75 studies, moderate power with 25 studies”.
4. References
- CAMS_2024_Modules_COM_A3 (cityu.edu.hk)
- https://www.stata.com/manuals/meta.pdf
- Introduction to Meta-Analysis in Stata (ucla.edu)
- Microsoft Word - pub_text.doc (york.ac.uk)
- Guido Schwarzer, Carpenter, J. R., & Gerta Rücker. (2015). Meta-analysis with R. Springer.
- “P-Curve” by Simonsohn, Nelson, and Simmons - YouTube