Table of contents
Type I Error & Type II Error
Type I error occurs when the null hypothesis H0 is rejected even though it is actually true:
Type II error occurs when the null hypothesis H0 is not rejected even though it is actually false:
We face a trade-off between Type I error and Type II error when constructing a test (the following is the sampling distribution of the sample mean):
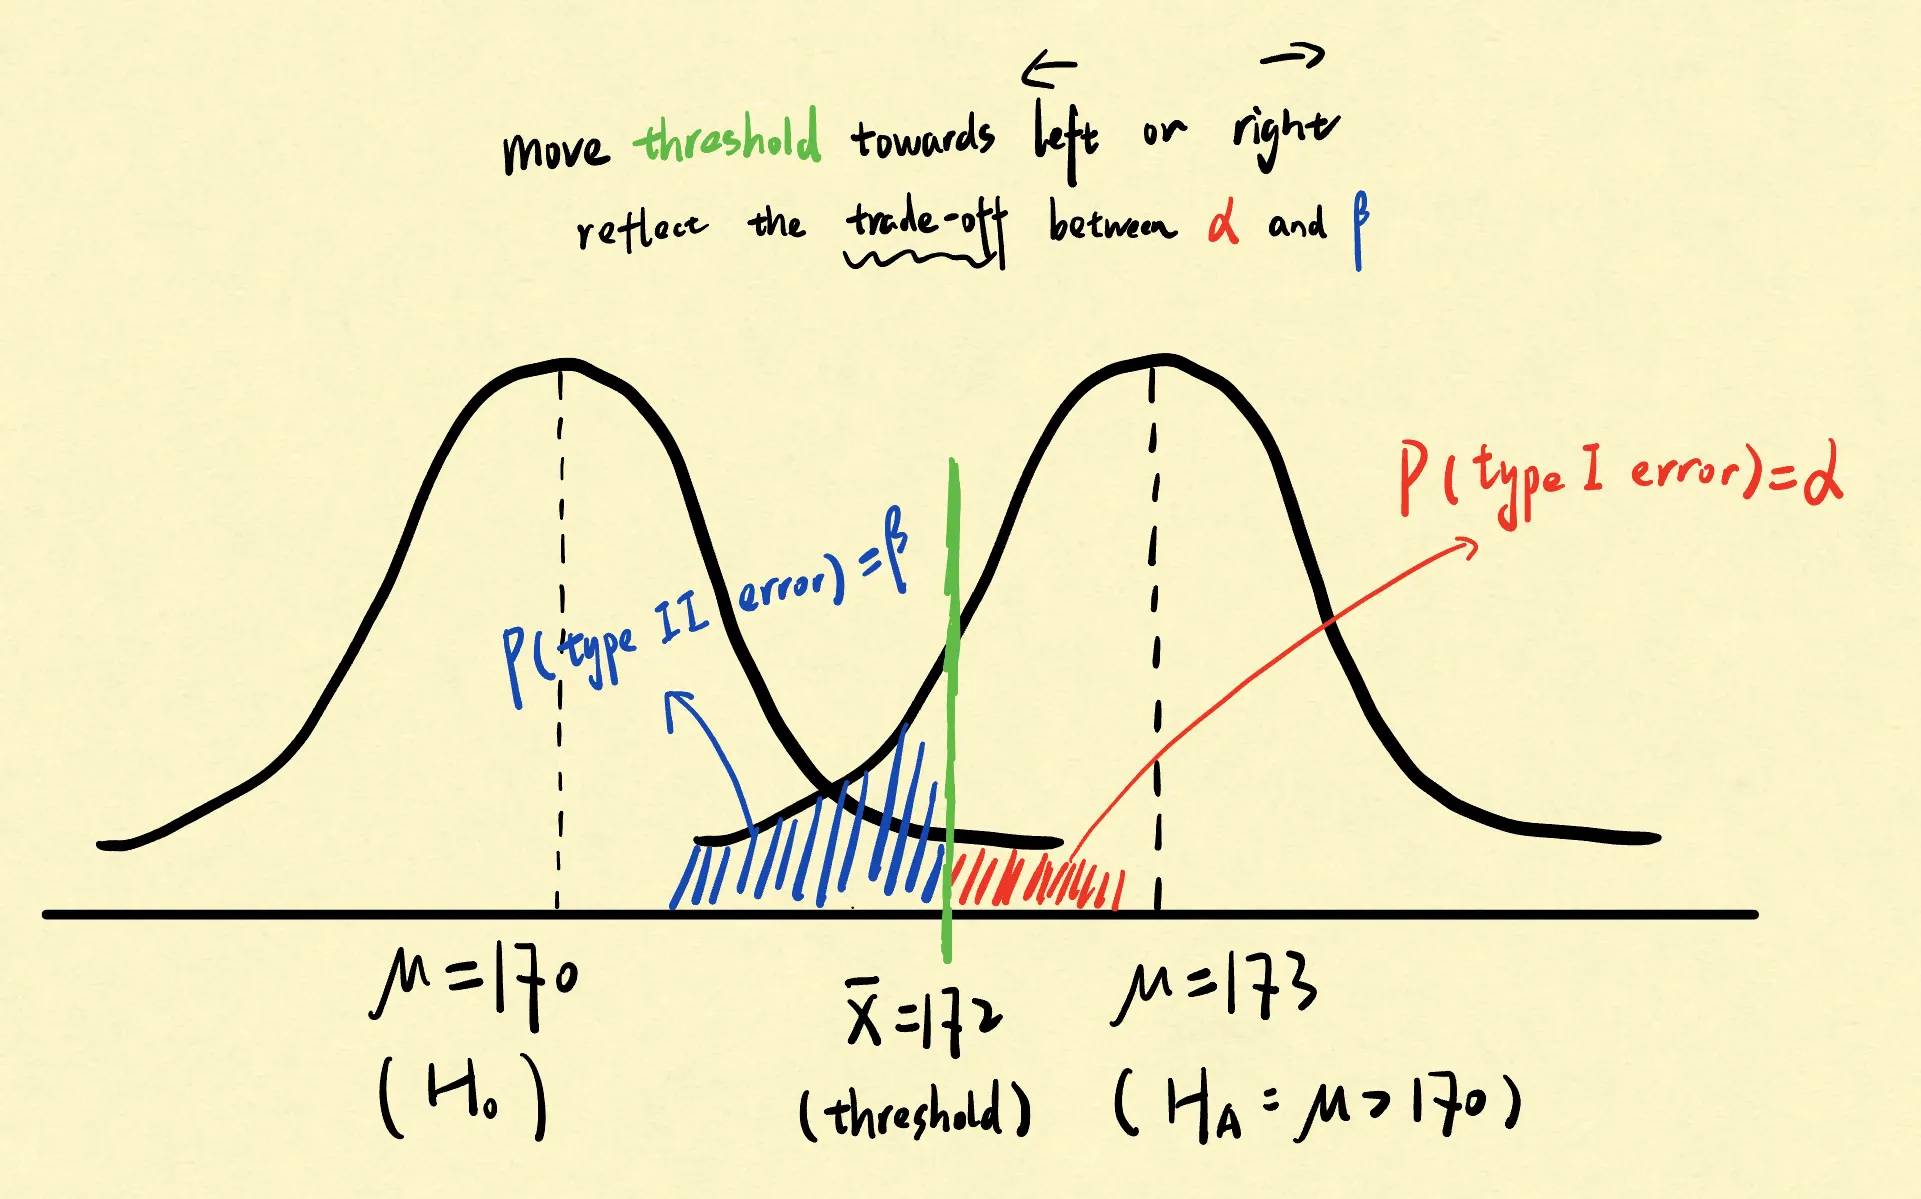
Therefore, when constructing a hypothesis test, it is typical to first set the probability of Type I error occurring, i.e. the significance level of the test, such as 0.05. Subsequently, based on this value, we calculate the threshold for a particular statistic, resulting in a specific hypothesis test.
Conversely, when provided with a specific test, we can calculate its significance level based on its threshold, representing the probability of committing a Type I error.
Power
The power of a test is the probability that the test correctly rejects the H0 when alternative hypothesis H1 is true. It is the reverse of the probability of Type II error:
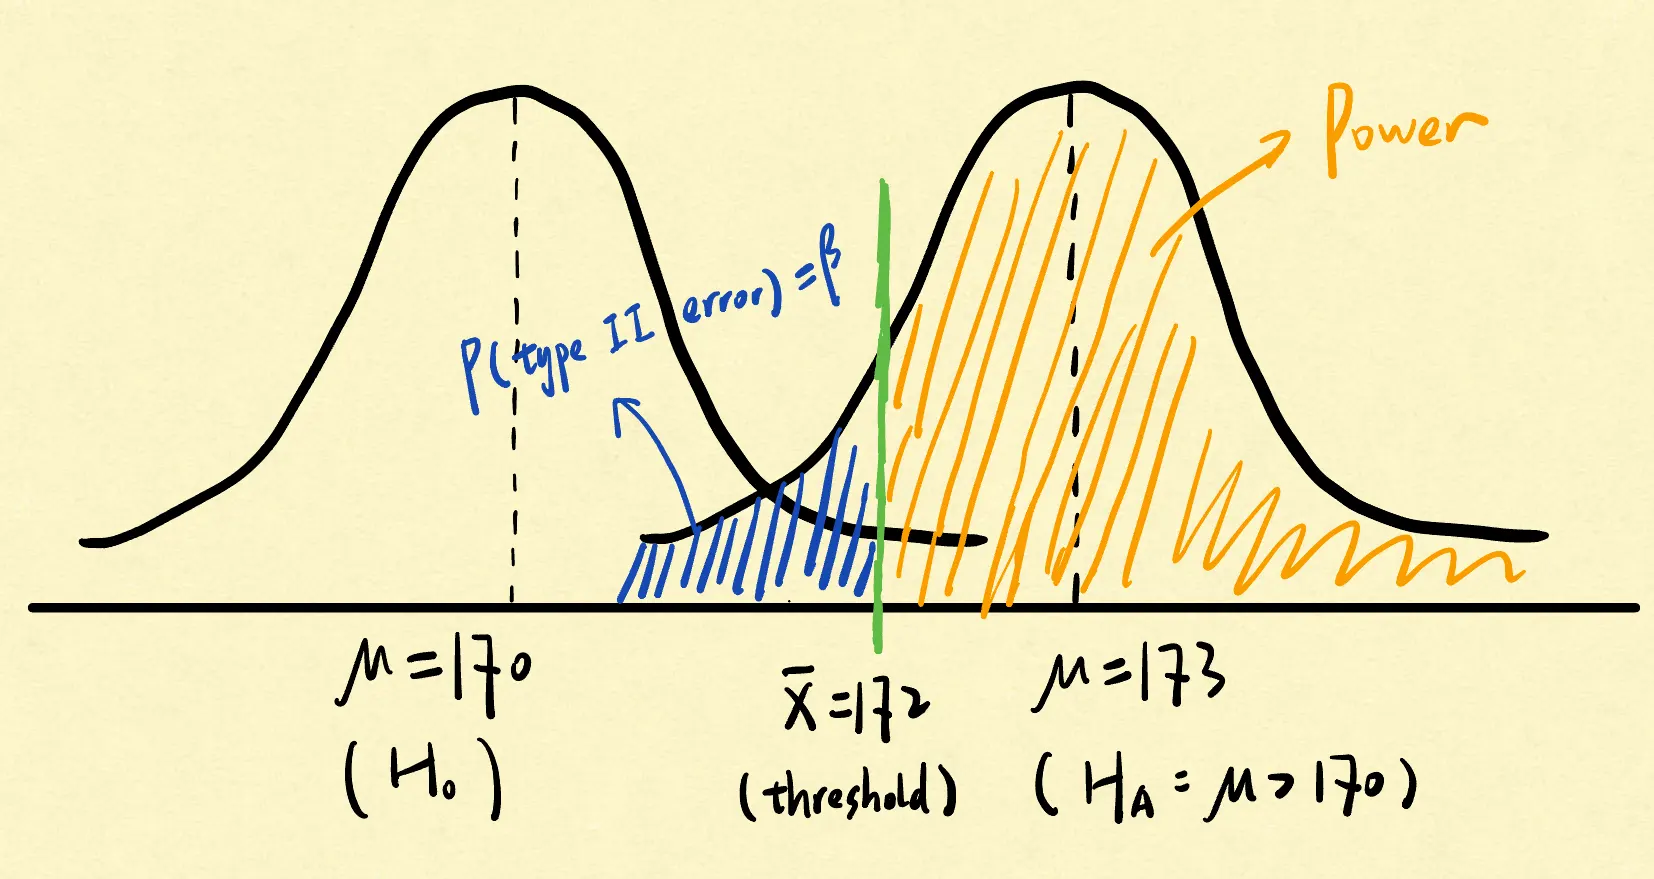
However, you may wonder how we can determine the power of our test, given that we lack knowledge of the true parameter under H1. In most cases, H1 contains an infinite number of possible values of the parameter (for example, μ>172 implies μ could be 173, 174, and so forth).
Nonetheless, we can construct the hypothesis test so that it has “enough power” to reject the H0 in favor of values of the parameter under the H1 that are scientifically meaningful. In other words, we can ensure that when the true parameter falls within, for example, the range of 171 to 180, the power of our hypothesis test will always exceed a certain threshold.
Power Function
The power of a hypothesis test depends on the value of the parameter being examined:
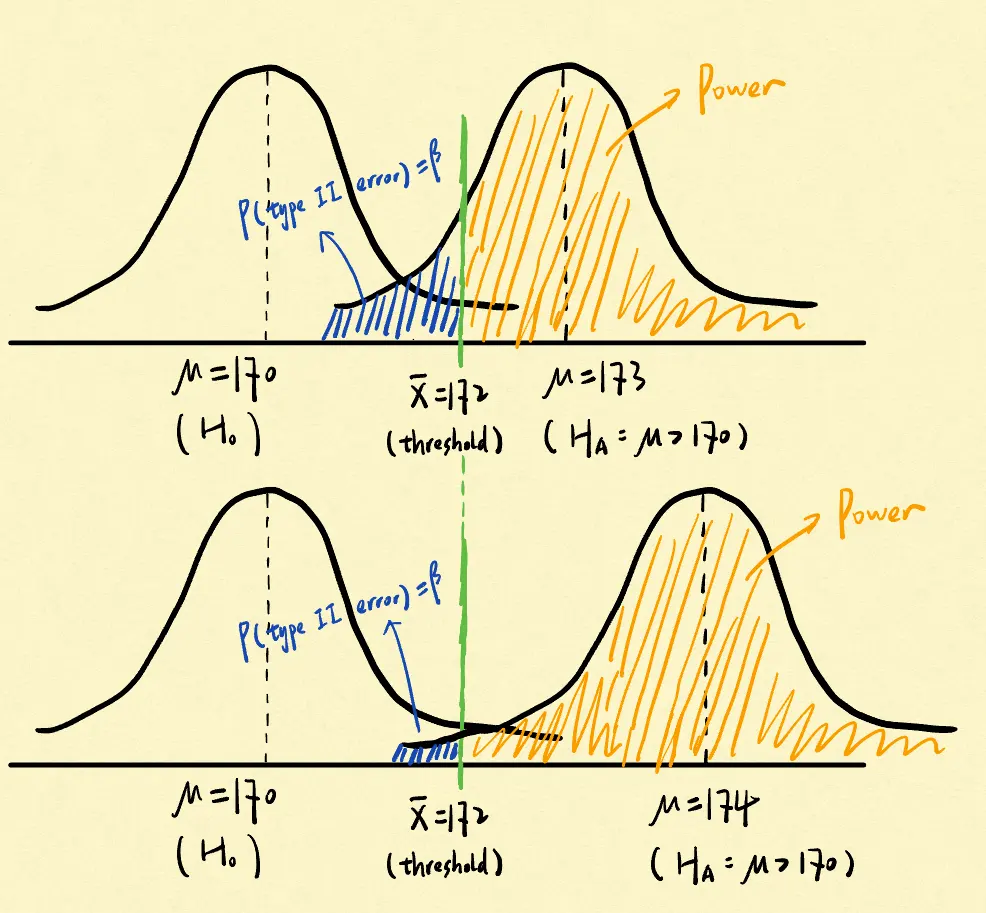
Hence, we can draw a plot like that - it is the power function:
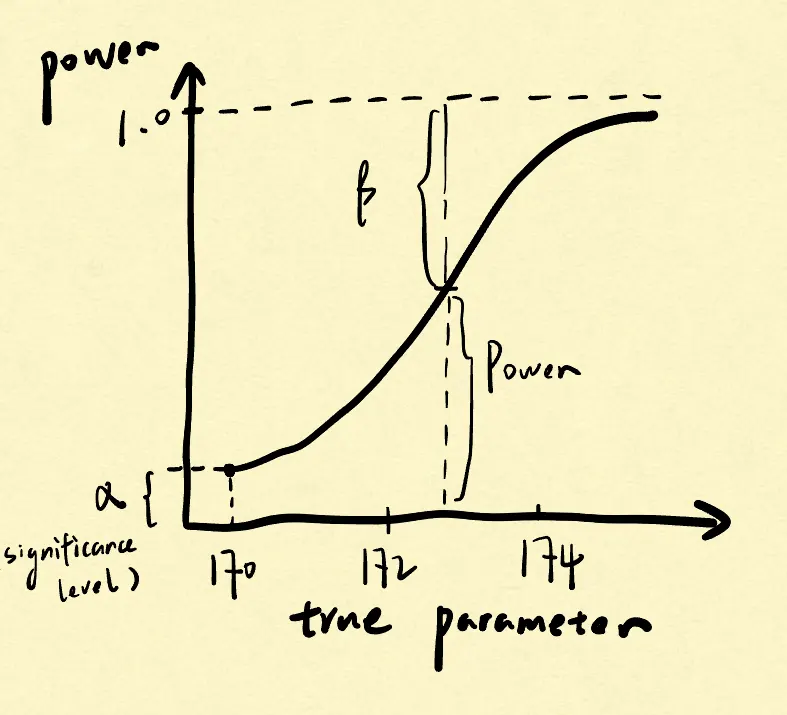
We can see that when the true parameter (i.e., alternative) is further away from the value specified by the null, indicating a larger potential effect size, the test has more power.
Altering the significance level α will cause the curve to move either upwards or downwards:
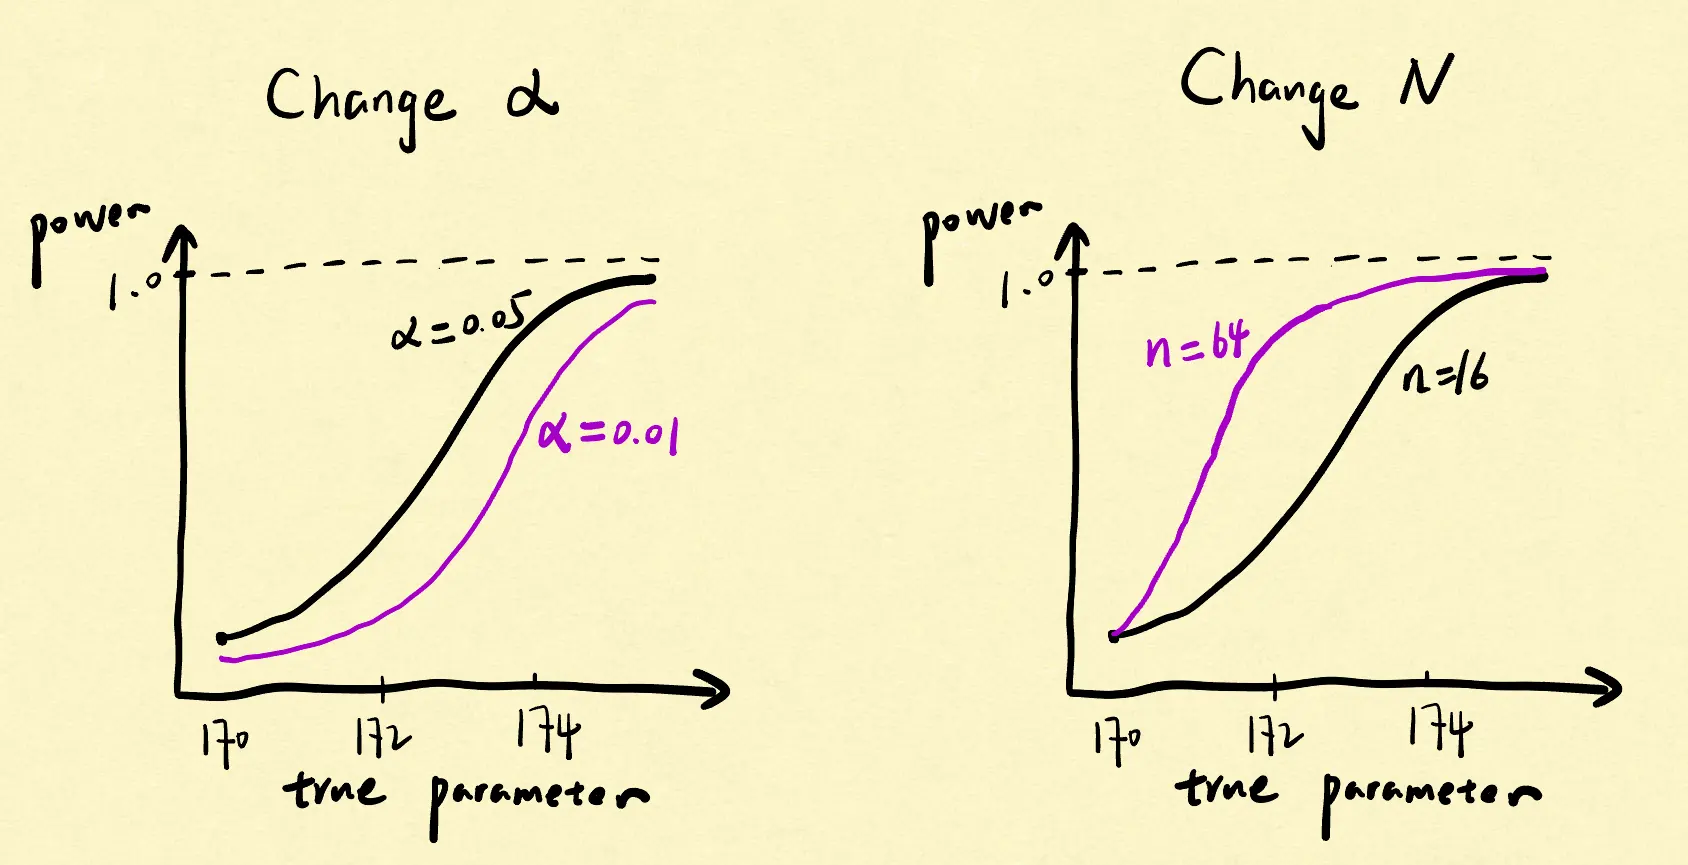
Increasing the sample size N can decrease the α and β simultaneously by providing a more narrow sampling distribution:
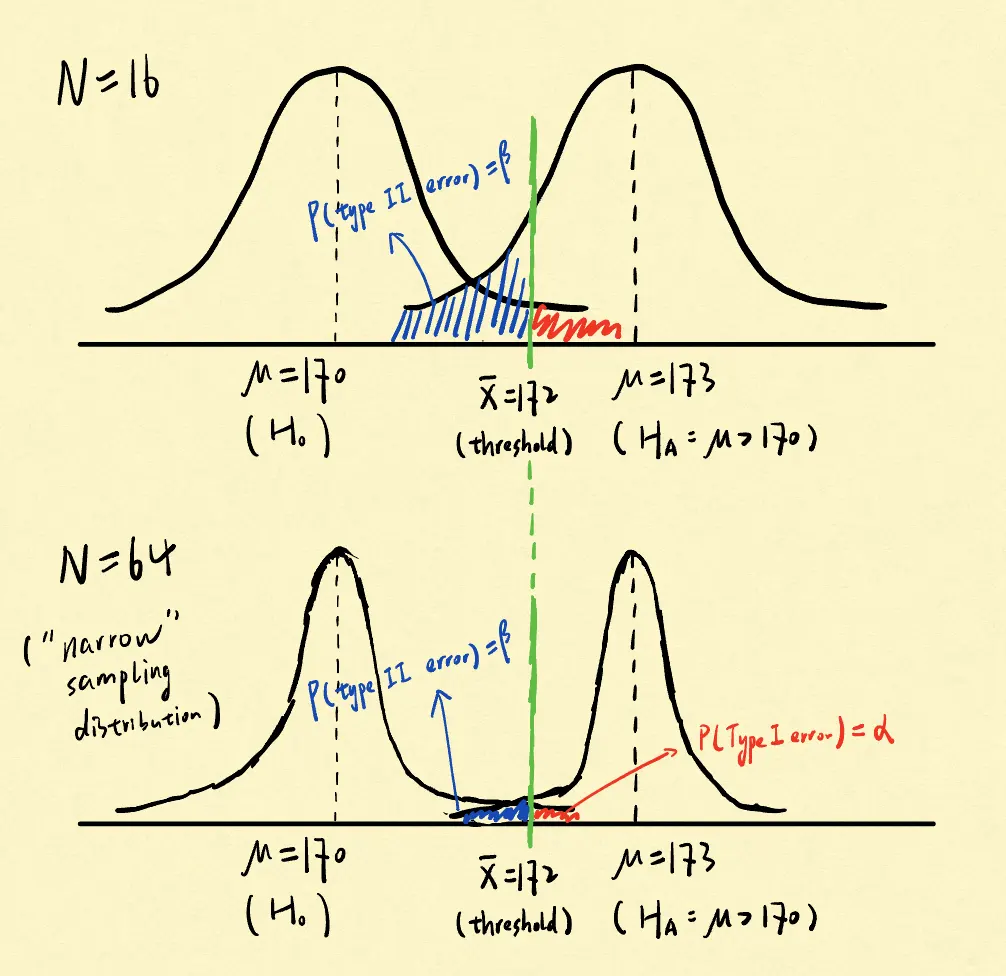
In summary, the power of a test is mainly associated with three factors: 1) the true parameter (power function); 2) the significance level α (trade-off); 3) the sample size N (larger is always better).
References
- Lesson 25: Power of a Statistical Test | STAT 415. Penn State University.
- 陈希孺. (2009). 《概率论与数理统计》, 第5.1节.
- 显著性测试的功效介绍 | 可汗学院.
- Imai, K. (2017). Quantitative Social Science: An Introduction, Chapter 7.2.6, Power Analysis.