Table of contents
Brief introduction
- Factor analysis is a data reduction technique:
- many items → few factors
- item = observable variable
- factor = latent (or hidden) variable
- Assump: hidden variables → correlation between observable variables
- Factor analysis groups items based on inter-correlations:
- which items can be grouped together and form a single factor
- Exploratory factor analysis & Confirmatory factor analysis
- EFA: identify whether the categorization you have done stands or not - EFA for identifying data patterns
- CFA: test hypotheses (i.e. data fits your model or not) - CFA for confirming a established theory
Exploratory factor analysis
- The task of EFA is to group the items that are most correlated:
- 组内高度相关,组间最好不相关
- Two pre-tests before doing EFA:
- KMO measure of sampling adequacy: whether the sample you have collected is good enough to do EFA or not; need to greater than 0.6.
- Bartlett’s test of sphericity: whether the items are uncorrelated in the population (H0: uncorrelated); need to smaller than 0.05, which indicate to reject the H0, showing that the items are correlated.
- Than do EFA and get results…
- How to determine the number of factors? Factor’s eigenvalue = the variance explained by this factor (i.e. sum of squared loadings); Factors having eigenvalues over 1 are selected (i.e. Kaiser’s rule).
- Can often get the absolute (
Proportion Var) and cumulative (Cumulative Var) proportion of variance explained by each factor.
- Can often get the absolute (
- Commumality (of an item)
- The proportion of this item’s variance explained by the factors
- if < 0.6, better to remove this item
- Commumality = 1 - Uniquenesses
- Uniquenesses (of an item): The proportion of this item’s variance that cannot be explained by the factors
- Factor loading (of a factor)
- Simple correlation between the item and the factor
- We can use different “Rotation” to adjust the loadings - e.g.
Varimax- to make the loading patterns easy to understand.- In this case, the total amount of variation explained by the factors remains the same. However, the distribution of this explained variation will change (ref).
- We want one factor to have a big loading on some items and another to have big loadings on other items - no cross-loading.
- set up thresholds for loadings, like 0.5 (e.g. 0.03 → 0.00)
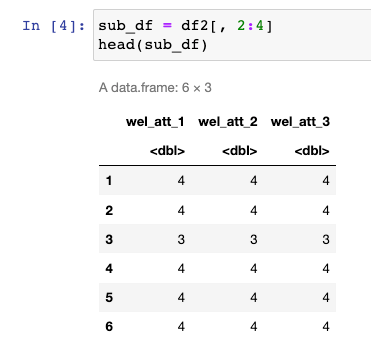
A simple example
library(psych)
library(REdaS)
We aim to identify the optimal number of factors (1 or not) that can be extracted from three items related to welfare attitudes:
First, compute KMO and do Bartletts test of spherecity:
# KMO值为0.68,大于0.6,说明适合进行进一步的因子分析
bart_spher(sub_df)   # produces Bartletts test of spherecity (you want this to be significant)
KMO(sub_df)          # kaiser-Meyer-olkin measure, you want to be above 0.6
Bartlett's Test of Sphericity
Call: bart_spher(x = sub_df)
X2 = 11525.863
df = 3
p-value < 2.22e-16
Kaiser-Meyer-Olkin factor adequacy
Call: KMO(r = sub_df)
Overall MSA = 0.68
MSA for each item =
wel_att_1 wel_att_2 wel_att_3
0.81 0.63 0.64Second, do factor analysis:
# do not use specific rotation
# because our objective is not to interpret the loadings
fa(sub_df, nfactors = 3, rotate = "none")
Factor Analysis using method = minres
Call: fa(r = sub_df, nfactors = 3, rotate = "none")
Standardized loadings (pattern matrix) based upon correlation matrix
MR1 MR2 MR3 h2 u2 com
wel_att_1 0.61 0.09 0 0.38 0.62 1
wel_att_2 0.86 0.00 0 0.74 0.26 1
wel_att_3 0.83 -0.07 0 0.69 0.31 1
MR1 MR2 MR3
SS loadings 1.79 0.01 0.0 (← here)
Proportion Var 0.60 0.00 0.0
Cumulative Var 0.60 0.60 0.6
Proportion Explained 0.99 0.01 0.0 (← here)
Cumulative Proportion 0.99 1.00 1.0
Mean item complexity = 1
Test of the hypothesis that 3 factors are sufficient.
df null model = 3 with the objective function = 1.07 with Chi Square = 11525.86
df of the model are -3 and the objective function was 0
The root mean square of the residuals (RMSR) is 0
The df corrected root mean square of the residuals is NA
The harmonic n.obs is 10808 with the empirical chi square 0 with prob < NA
The total n.obs was 10808 with Likelihood Chi Square = 0 with prob < NA
Tucker Lewis Index of factoring reliability = 1
Fit based upon off diagonal values = 1
Measures of factor score adequacy
MR1 MR2 MR3
Correlation of (regression) scores with factors 0.92 0.17 0
Multiple R square of scores with factors 0.85 0.03 0
Minimum correlation of possible factor scores 0.70 -0.95 -1Third, interpret the results:
- SS loadings: Since only one factor has an eigenvalue (i.e., explained variance) greater than 1, which accounts for 99% of the total explained variance, it is optimal to consider just one factor in this case.
At last, we can use derived loadings to do data transformation:
r = fa(sub_df, nfactors = 1, rotate = "none", scores=TRUE)
r$scores
A matrix: 10808 × 1 of type dbl
MR1
0.6934161
0.6934161
-1.2634223
0.6934161
0.6934161
...